Use JMeter to assess software performances
One of my side projects (the Telegram Photo Bot), have some performance issues that I will have to tackle. I could have jumped into the code and changed something, hoping it will improve performances. But that would be ineffective and unprofessional. So, I decided to have an honest measure of the current performances as well as a reproducible setup to have consistent measures over time.
This article explains how I built my performance testing lab using JMeter and an old ARM board. To keep this article short and readable, I focused on the assessment of two HTTP libraries (golang’s net/http and valyala’s fasthttp), leaving the discussion about the Telegram Photo Bot performances for a next article.
Hardware setup
When building my lab, I chose the smallest computer I had at home to host the thing to be assessed. The reason is: the more powerful is the server, the more steady needs the network setup to be, the more powerful the injector needs to be. If the rest of your setup is not up to the task, you are measuring something that is not the performances of the thing but rather the performances of your network or the injector itself! We will see a good demonstration of this in the rest of the article.
So, the target hardware is an ARMv5 board with only one core running at 1.2 GHz, 128 MB of RAM and 256 MB of Flash. It was a cheap NAS device in its previous life. I installed OpenWRT on this little device.
The injector is hosted on my Macbook Pro, a Core i7 at 2.5 GHz. This will provide a comfortable margin before reaching the limits of the injector.
The network is composed of Ubiquiti devices and for the scope of this article, the main device is a Ubiquiti EdgeSwitch ES-8-150W.
Software setup
Install JMeter by downloading the latest release from jmeter.apache.org.
curl -Lo /tmp/apache-jmeter.tgz https://downloads.apache.org/jmeter/binaries/apache-jmeter-5.3.tgz
mkdir -p /usr/local/opt/
tar zxvf /tmp/apache-jmeter.tgz -C /usr/local/opt/
mv /usr/local/opt/apache-jmeter-* /usr/local/opt/jmeter/
Install the JMeter Plugin Manager.
curl -Lo /usr/local/opt/jmeter/lib/ext/jmeter-plugins-manager-1.4.jar https://jmeter-plugins.org/get/
Start JMeter.
/usr/local/opt/jmeter/bin/jmeter.sh &
Go to Options > Plugins Manager, in the Available Plugins tab, select jpgc - Standard Set and validate.
Always have a control in your experience!
In science, a control is used to eliminate alternate explanations of experimental results, especially experimental errors and experimenter bias. For performance testing purposes, this could be an unmodified version of the software (to be compared with different flavours) or a reference software for which the performances are well-known.
In my lab, I chose an nginx instance to be my control. This software has been proved to be performing well, stable and scalable. It is a good candidate to give a stable reference.
I installed nginx on my target hardware.
opkg update
opkg install nginx
The relevant parts of my nginx configuration file (to host a static file on port 80) is given below.
worker_processes auto;
worker_cpu_affinity auto;

events {
    worker_connections 1024;
    multi_accept on;
}

http {
    access_log off;
    sendfile on;
    keepalive_timeout 65;
    gzip off;

    server {
        listen 0.0.0.0:80 deferred;

        root /srv/nginx/default;
        index index.html index.htm;
    }
}
My first measure on the control (nginx) gave strange results.
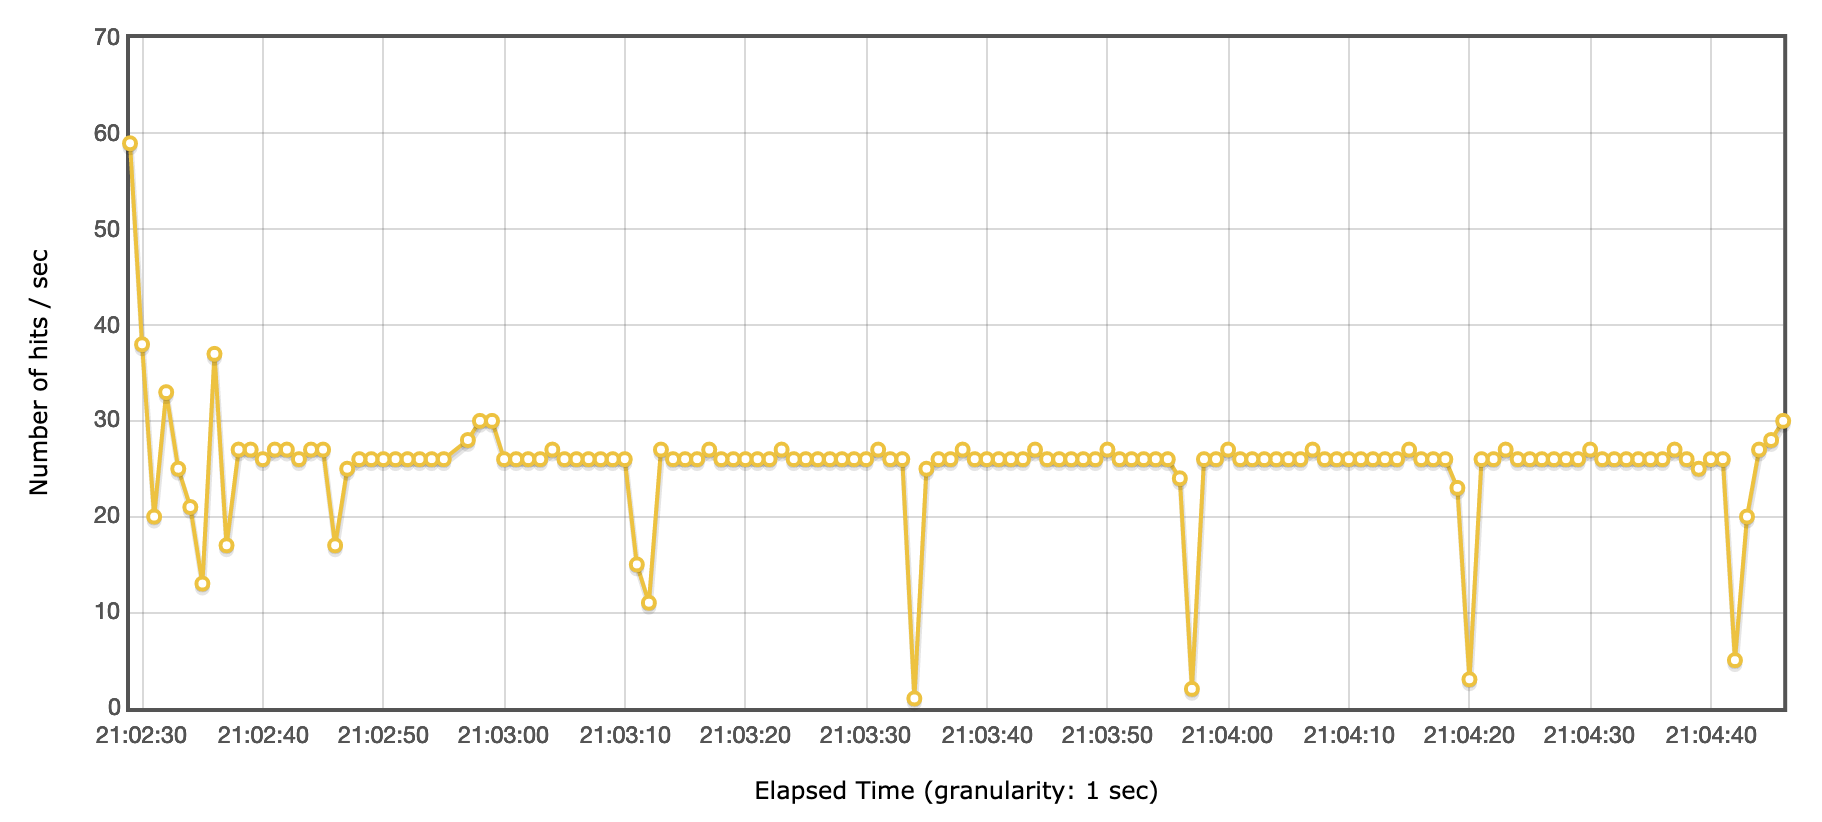
Less than 30 tps, even on an old ARM board, is definitely too low to be representative of nginx’s performances. Using Wireshark, I discovered that JMeter did not established Keep-Alive connections.
In wireshark, the following query keeps only the first packet of each TCP connection. And the Displayed counter in the bottom right corner, show the number of packets matching this query and thus the number of connections opened during the test.
tcp.flags.syn==1 && tcp.flags.ack==0
I enabled Keep-Alive connections in my JMeter Test Plan by:
- enclosing my HTTP Probe in an infinite Loop
- changing the Client Implementation to HttpClient4 in my HTTP Probe
- setting Keep-Alive timeouts in user.properties
httpclient4.idletimeout=10000
httpclient4.time_to_live=60000
httpclient4.validate_after_inactivity=10000
- If you cannot put your HTTP Probe in an infinite Loop, you have to disable “state reset” between Thread Group iterations (in user.properties).
httpclient.reset_state_on_thread_group_iteration=false
With Keep-Alive enabled, the 1200 tps are much more inline with the known performance level of nginx. Except there is a performance drop every 10-15 seconds that is not expected.
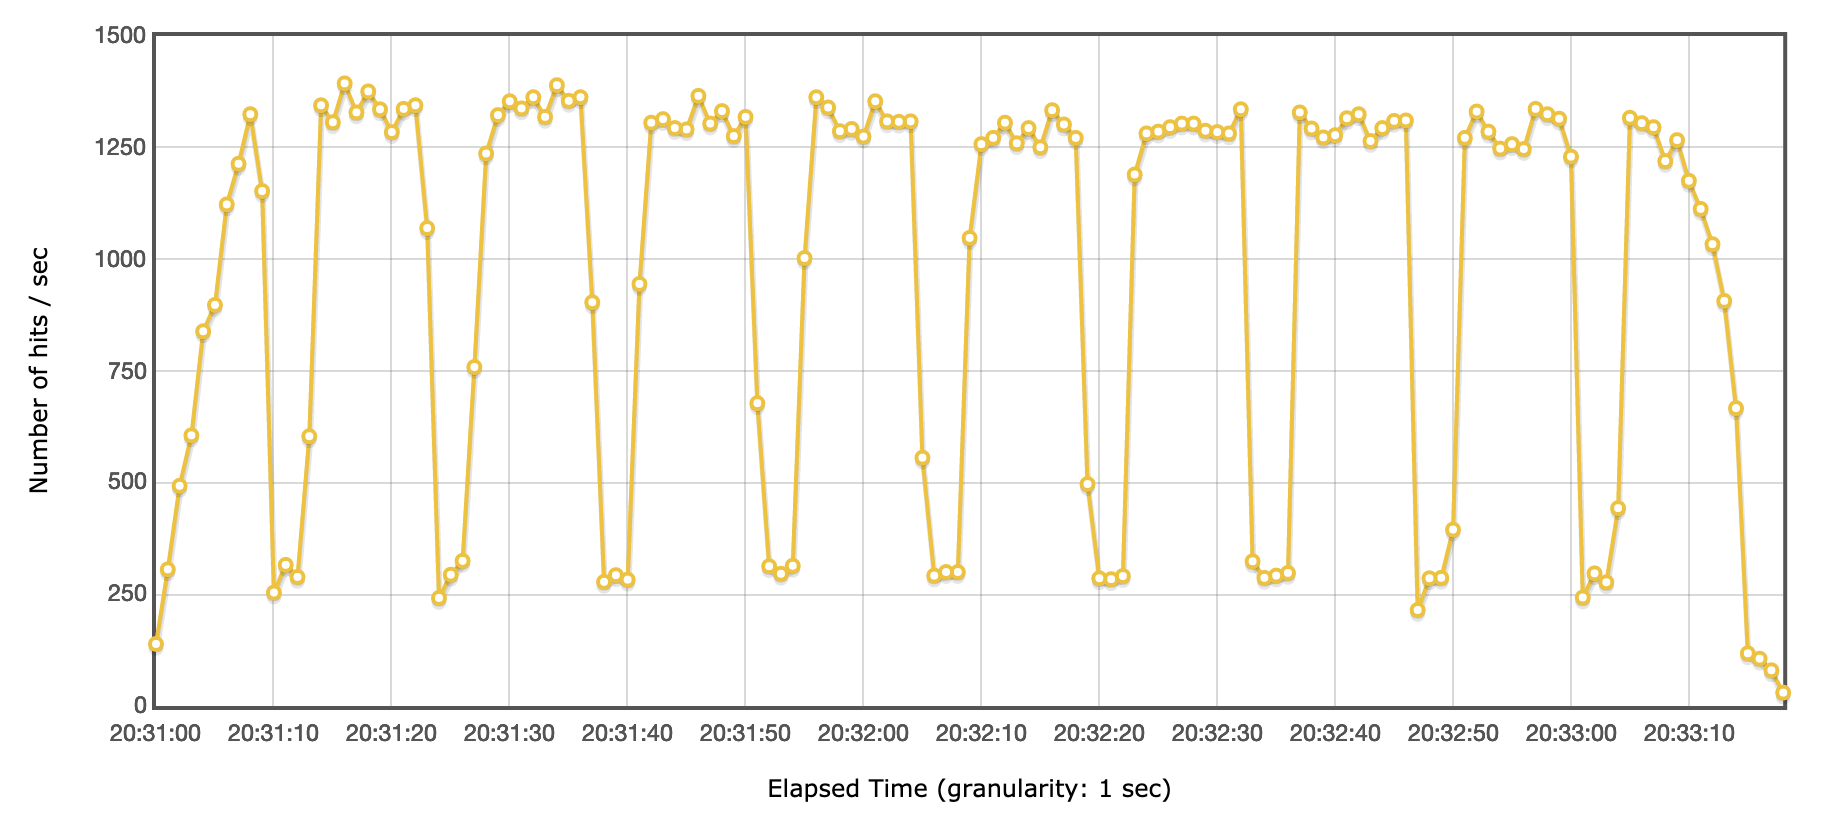
Using Wireshark, I discovered that during those performance drops, there are TCP packets retransmissions. At that time, my Macbook Pro hosting the injector was connected using Wifi. I switched to a good old Ethernet cable, and this time the results on the control were as expected.
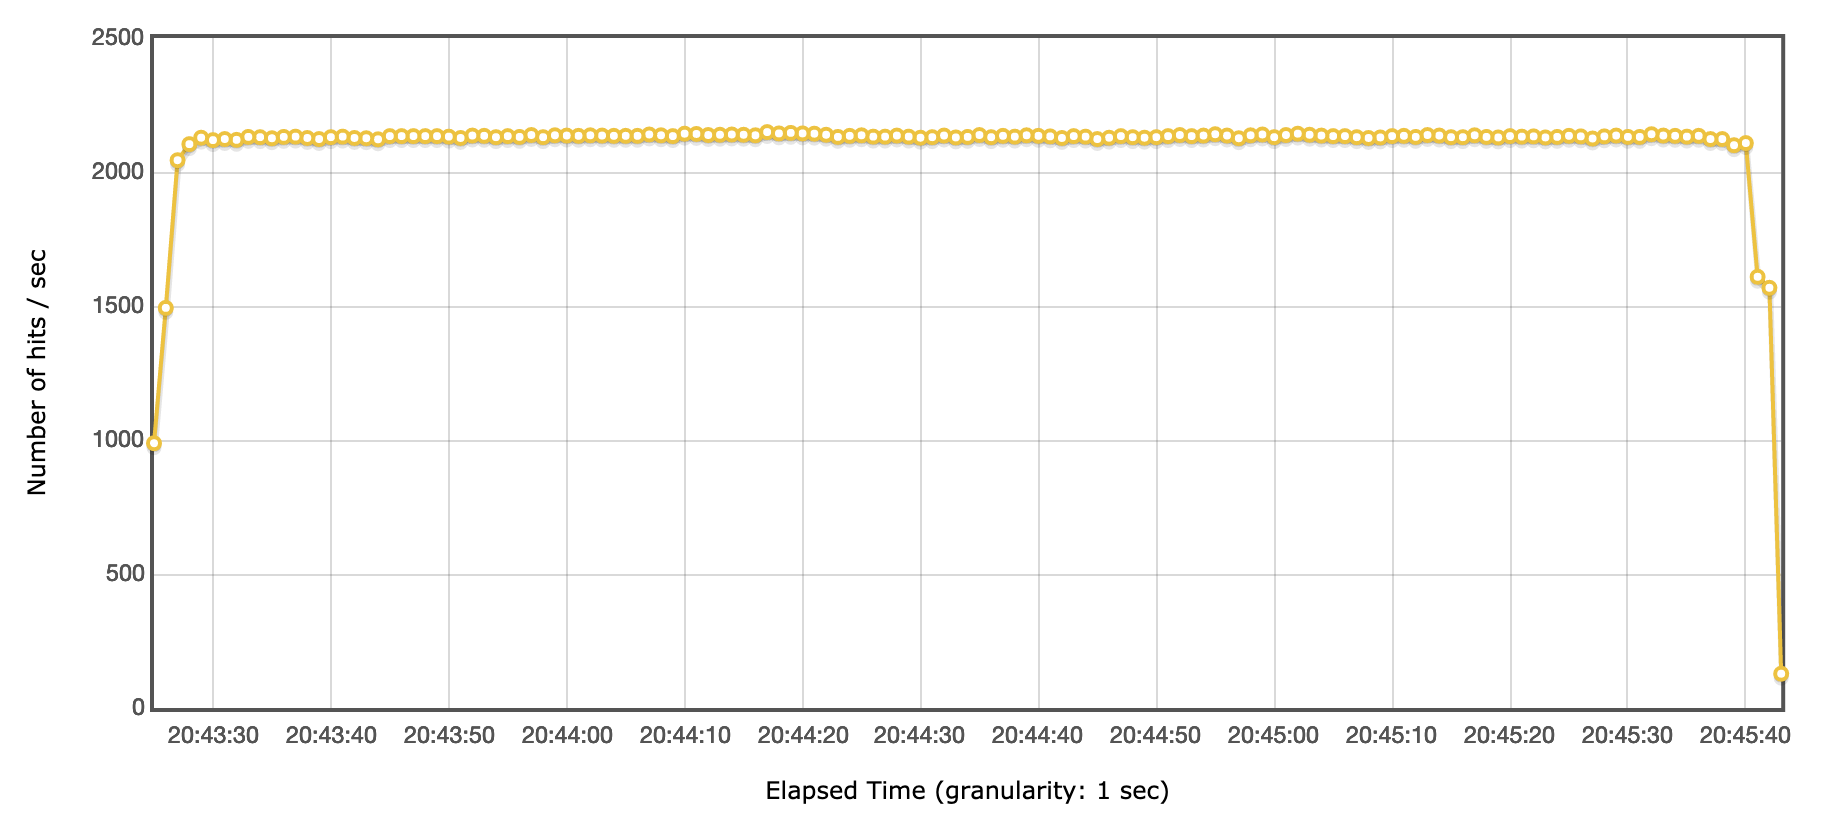
As a conclusion, always have a control in your experience!
JMeter Test Plan
To build my JMeter Test Plan, I started by adding a User Defined Variables component that holds all the settings related to lab environment (DNS names, ports, tokens, etc.).
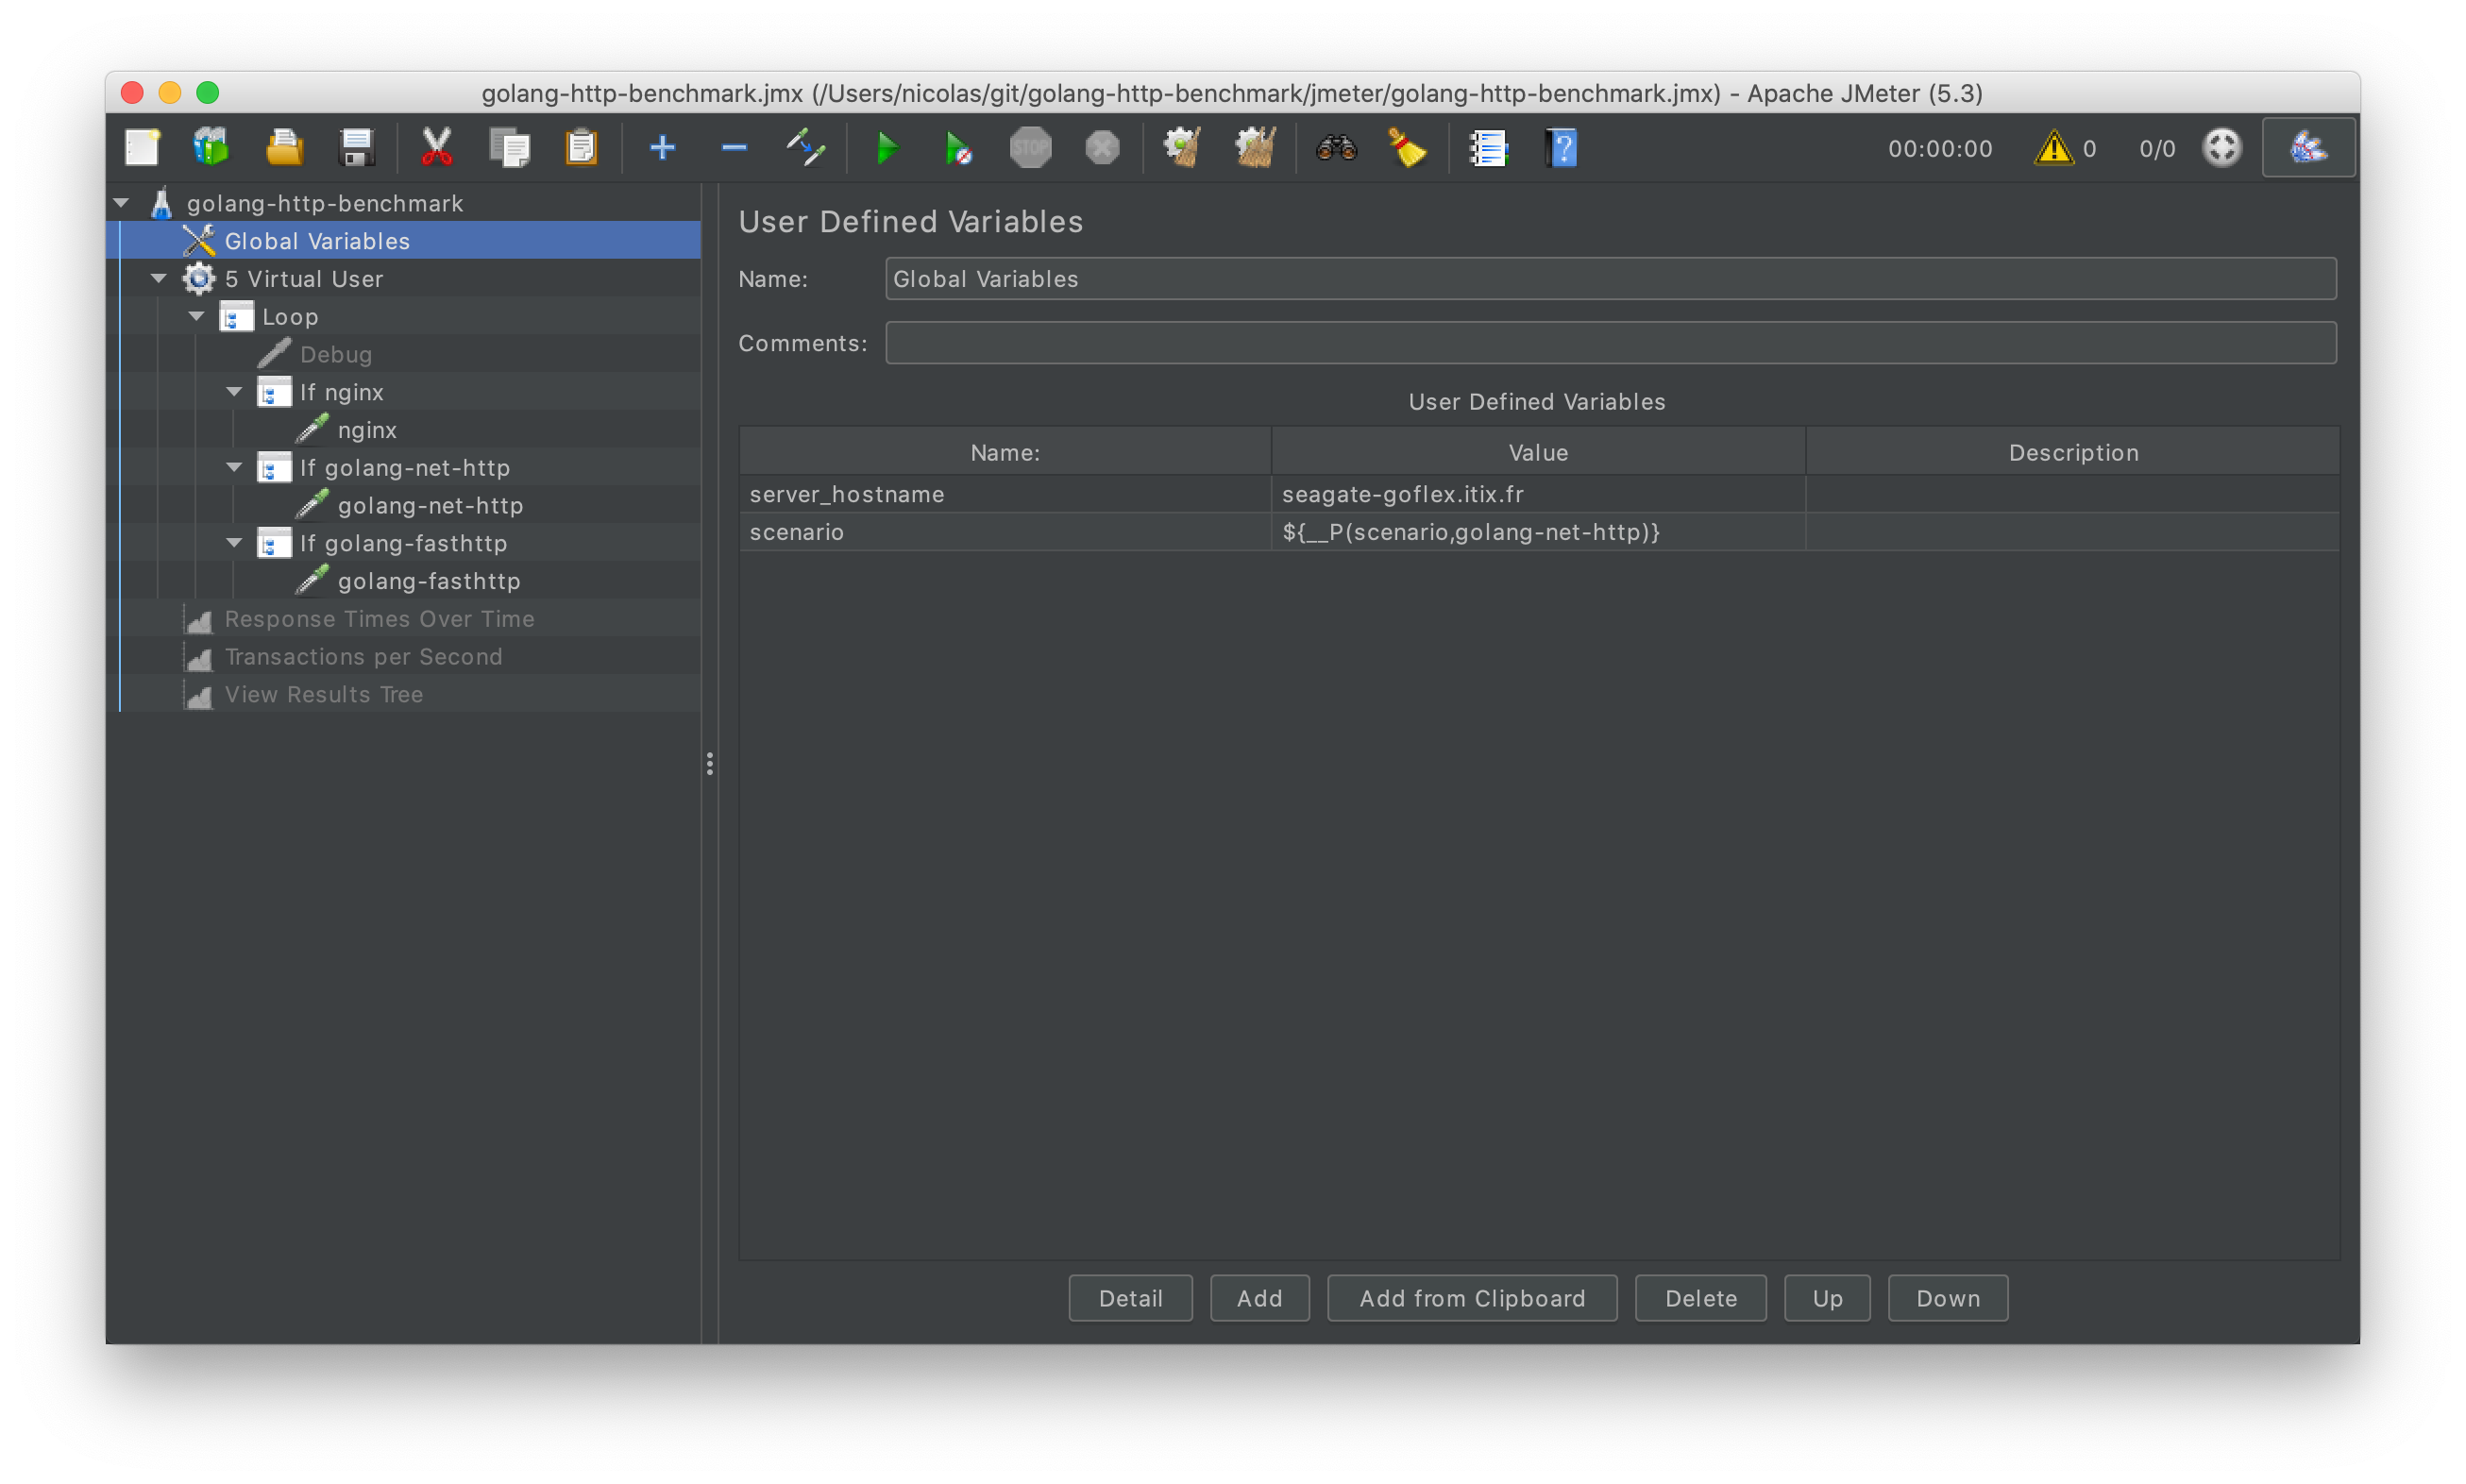
I added a variable named scenario whose value will be passed to JMeter from the CLI. This enables me to run all my experiments automatically from a script, one after another. This variable is defined as such:
${__P(parameter-name,default-value)}
I configured a Thread Group based on the jp@gc - Ultimate Thread Group with five concurrent users.
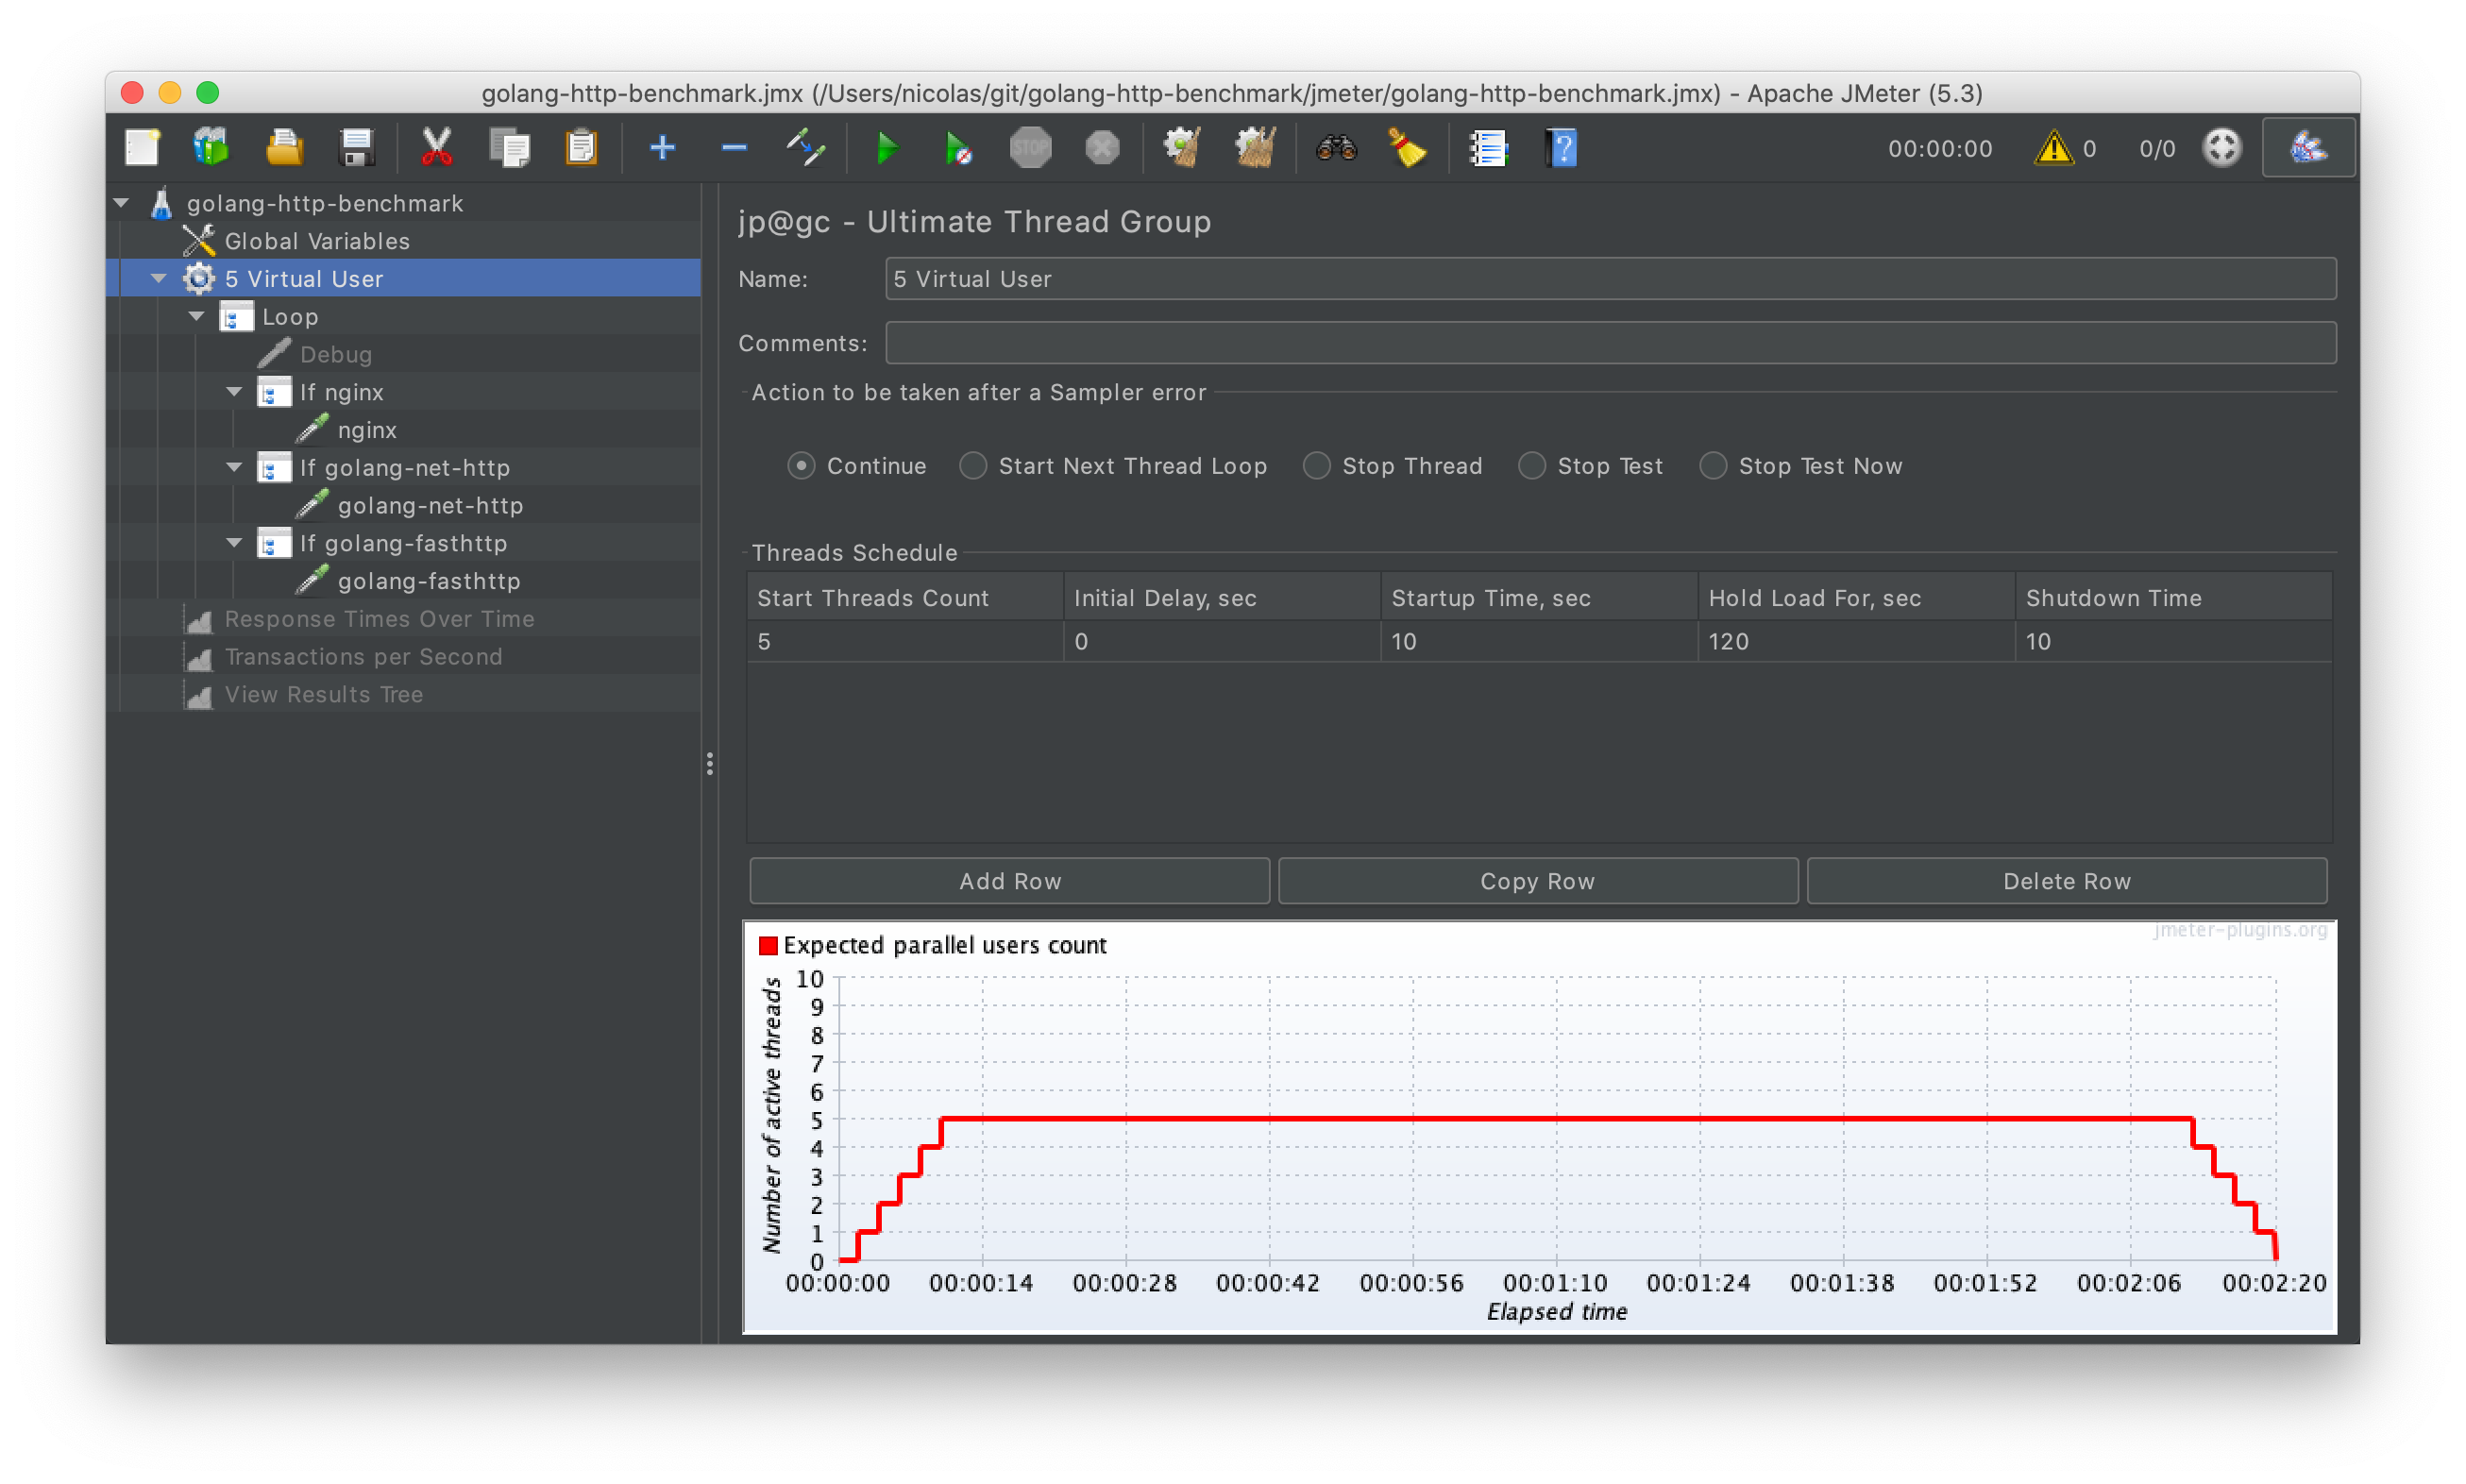
And finally, a Loop component with three If Controllers underneath. Each If Controller holds an HTTP Probe configured for the target scenario.
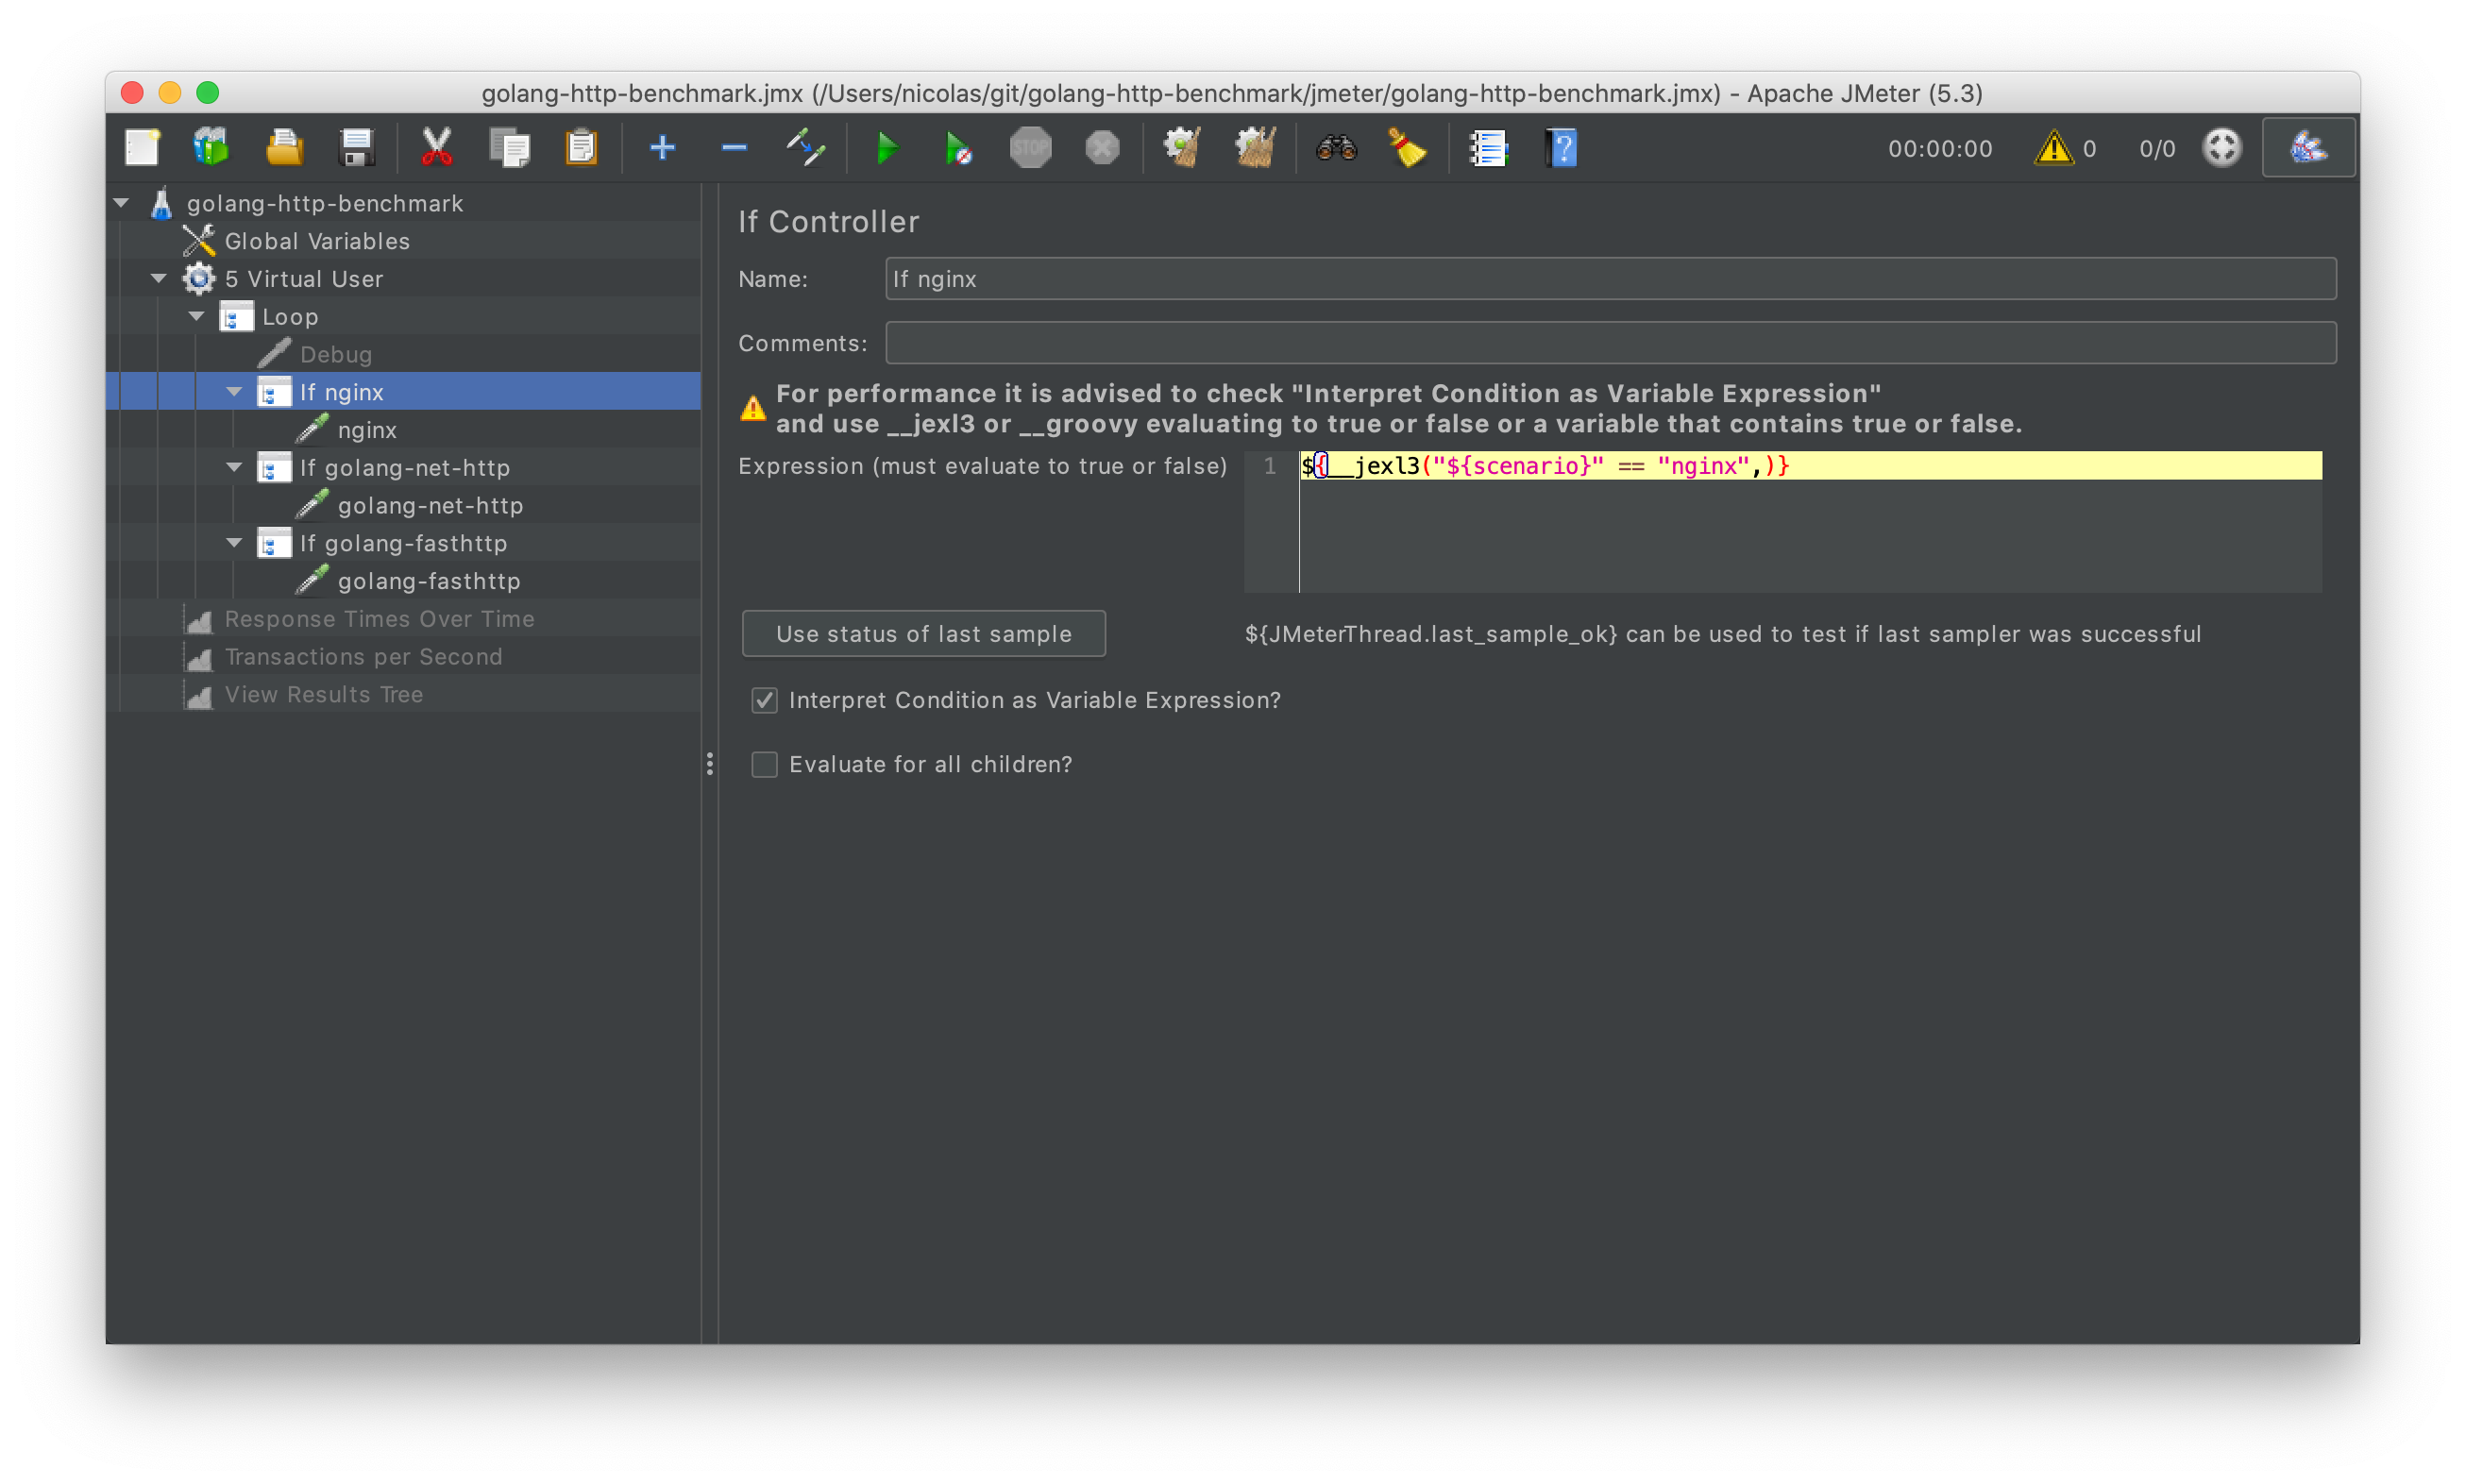
The If Controllers are defined with a jexl3 expression, asserting the value of the scenario variable.
${__jexl3("${scenario}" == "nginx",)}
The syntax is a bit awkward but it works.
You can check your Test Plan is working by adding the three following Listeners and running it.
- View Result Tree
- jp@gc - Response Times Over Time
- jp@gc - Transactions per Second
Running the Test Plan
The GUI of JMeter is there for designing Test Plans but not running actual tests. The proper performance tests are started from the CLI.
My three scenarios (nginx - the control, golang’s net/http and valyala’s fasthttp) are started one after another from a script, using the JMeter CLI.
date="$(date +%F-%H-%M-%S)"

for scenario in nginx golang-net-http golang-fasthttp; do
  echo
  echo "=============================="
  echo "Running scenario $scenario..."
  echo "=============================="
  echo
  jmeter -n -t golang-http-benchmark.jmx -l "results-$date-$scenario.csv" -e -o "report-$date-$scenario" -Jscenario=$scenario
  sleep 2
done
-Pfoo=bar can be used to pass parameters to the Test Plan.
The user.properties receives an additional setting to define the aggregate period for the report.
jmeter.reportgenerator.overall_granularity=1000
All the sources are in this Git Repository.
Results
This article is already quite long, so it is time to conclude with some results!
In my Lab, for my very narrow experiment, here are the numbers:
- nginx had a stable throughput of ~2200 tps and a stable average latency of 2.5ms
- valyala’s fasthttp had a rather stable throughput of ~3300 tps and an a stable average latency of 1.5ms
- golang’s net/http had a somewhat less stable throughput of ~1600 tps and an average latency oscillating around 3ms
In the next article, I will discuss the performances I measured for my side project: the Telegram Photo Bot.