How to run performance tests with K6, Prometheus and Grafana
K6 is a novel performance testing tool written in Go, using plain Javascript for the test definition and presenting the test results through Grafana. An existing article written in 2018 explains how to setup K6 with InfluxDB and Grafana, however Prometheus gained popularity over InfluxDB since then. Proper integration of K6 with Prometheus is a clear lack identified by the community. Here I explain how to integrate K6 with Prometheus using the existing StatsD support in K6, present the Grafana dashboard I built, and show how to use it. This integration fills a gap and provides a quick win for companies already using Prometheus.
StatsD ties K6 and Prometheus together
The K6 documentation does not mention any Prometheus support. This lack has been identified by the community and is tracked through the GitHub issue #1761).
In the meantime, we can use StatsD as a bridge between K6 and Prometheus since K6 has a native support for StatsD and Prometheus handle the StatsD protocol through its statsd_exporter.

K6 has two implementations of the StatsD protocol: statsd and datadog. The datadog implementation has the advantage of enabling the tags extension in the StatsD protocol. And since the statsd_exporter also has support for tags, we will use it in the rest of this article.
Installation
The whole stack is made easy to install since all components are available as containers. This article explains how to set it up on Fedora using Podman.
Create the statsd_exporter configuration file.
defaults:
  observer_type: histogram
mappings:
- match: "k6.*"
  name: "k6_${1}"
- match: "k6.check.*.*.*"
  name: "k6_check"
  labels:
    http_name: "$1"
    check_name: "$2"
    outcome: "$3"
This configuration instructs statsd_exporter to:
- rewrite the metrics names to make them easier to work with,
- and uses histograms instead of summaries.
Start the statsd_exporter.
sudo podman run -d --name statsd_exporter -p 9102:9102 -p 8125:8125/udp -v $PWD/statsd_exporter.yaml:/etc/statsd_exporter.yaml quay.io/prometheus/statsd-exporter:latest --statsd.listen-udp=:8125 --statsd.mapping-config=/etc/statsd_exporter.yaml
Create the Prometheus configuration that scrapes the statsd_exporter every second. It also filters out some labels that are not used in the Grafana dashboard. It is important to filter out the url label since it can lead to high cardinalities in Prometheus.
global:
  scrape_interval:      1s
  evaluation_interval:  1s

scrape_configs:
- job_name: 'statsd_exporter'
  static_configs:
  - targets: ['statsd_exporter.dns.podman:9102']
    labels: {}
  metric_relabel_configs:
  - regex: '(job|instance|url)'
    action: labeldrop
Start the Prometheus server.
sudo podman run -d --name prometheus -p 9090:9090 -v $PWD/prometheus.yaml:/etc/prometheus/prometheus.yml prom/prometheus
Start the Grafana server.
sudo podman run -d --name grafana -p 3000:3000 grafana/grafana
Confirm all three containers are running.
$ sudo podman ps
CONTAINER ID  IMAGE                                      COMMAND               CREATED        STATUS            PORTS                                           NAMES
704734475f83  docker.io/grafana/grafana:latest                                 4 minutes ago  Up 4 minutes ago  0.0.0.0:3000->3000/tcp                          grafana
493734aa08b3  docker.io/prom/prometheus:latest           --config.file=/et...  4 minutes ago  Up 4 minutes ago  0.0.0.0:9090->9090/tcp                          prometheus
39cd918d6682  quay.io/prometheus/statsd-exporter:latest  --statsd.listen-u...  4 minutes ago  Up 4 minutes ago  0.0.0.0:8125->8125/udp, 0.0.0.0:9102->9102/tcp  statsd_exporter
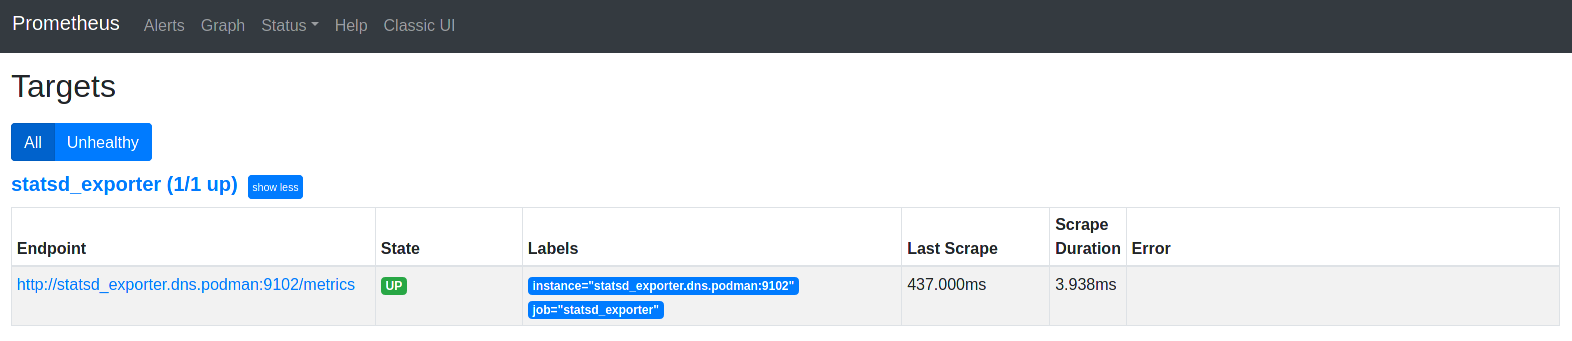
Open http://localhost:9090/targets and make sure Prometheus can scrape the statsd_exporter.
Open http://localhost:3000/ and login with admin / admin.
Then, configure the Prometheus datasource as follow.
- Navigate to Configuration > Datasources and click Add data source.
- Select Prometheus.
- Leave the default datasource name Prometheus.
- Fill in the URL with http://prometheus.dns.podman:9090/.
- Change the Scrape interval to 1s in order to match the value in the Prometheus configuration file.
- Click Save and test.
Restart the Grafana server, otherwise when importing the dashboard it might not find the datasource you created.
sudo podman stop grafana
sudo podman start grafana
Import the k6.io metrics with statsd_exporter and Prometheus dashboard.
- In the left sidebar, click the + button > Import.
- Paste the Dashboard ID: 13861
- Click Load.
- Select your Prometheus datasource.
- Click Import.
Install K6 locally as explained in the K6 installation guide. RPMs are provided for Fedora, CentOS Stream, RHEL and its derivatives.
wget https://bintray.com/loadimpact/rpm/rpm -O bintray-loadimpact-rpm.repo
sudo mv bintray-loadimpact-rpm.repo /etc/yum.repos.d/
sudo dnf install k6
Exploring the dashboard
There was a couple Grafana dashboards available in the community but none of them matched my requirements. So I designed my own that features measurement of the seven standard Go HTTP timings and tracking of multiple K6 HTTP request (by their name).
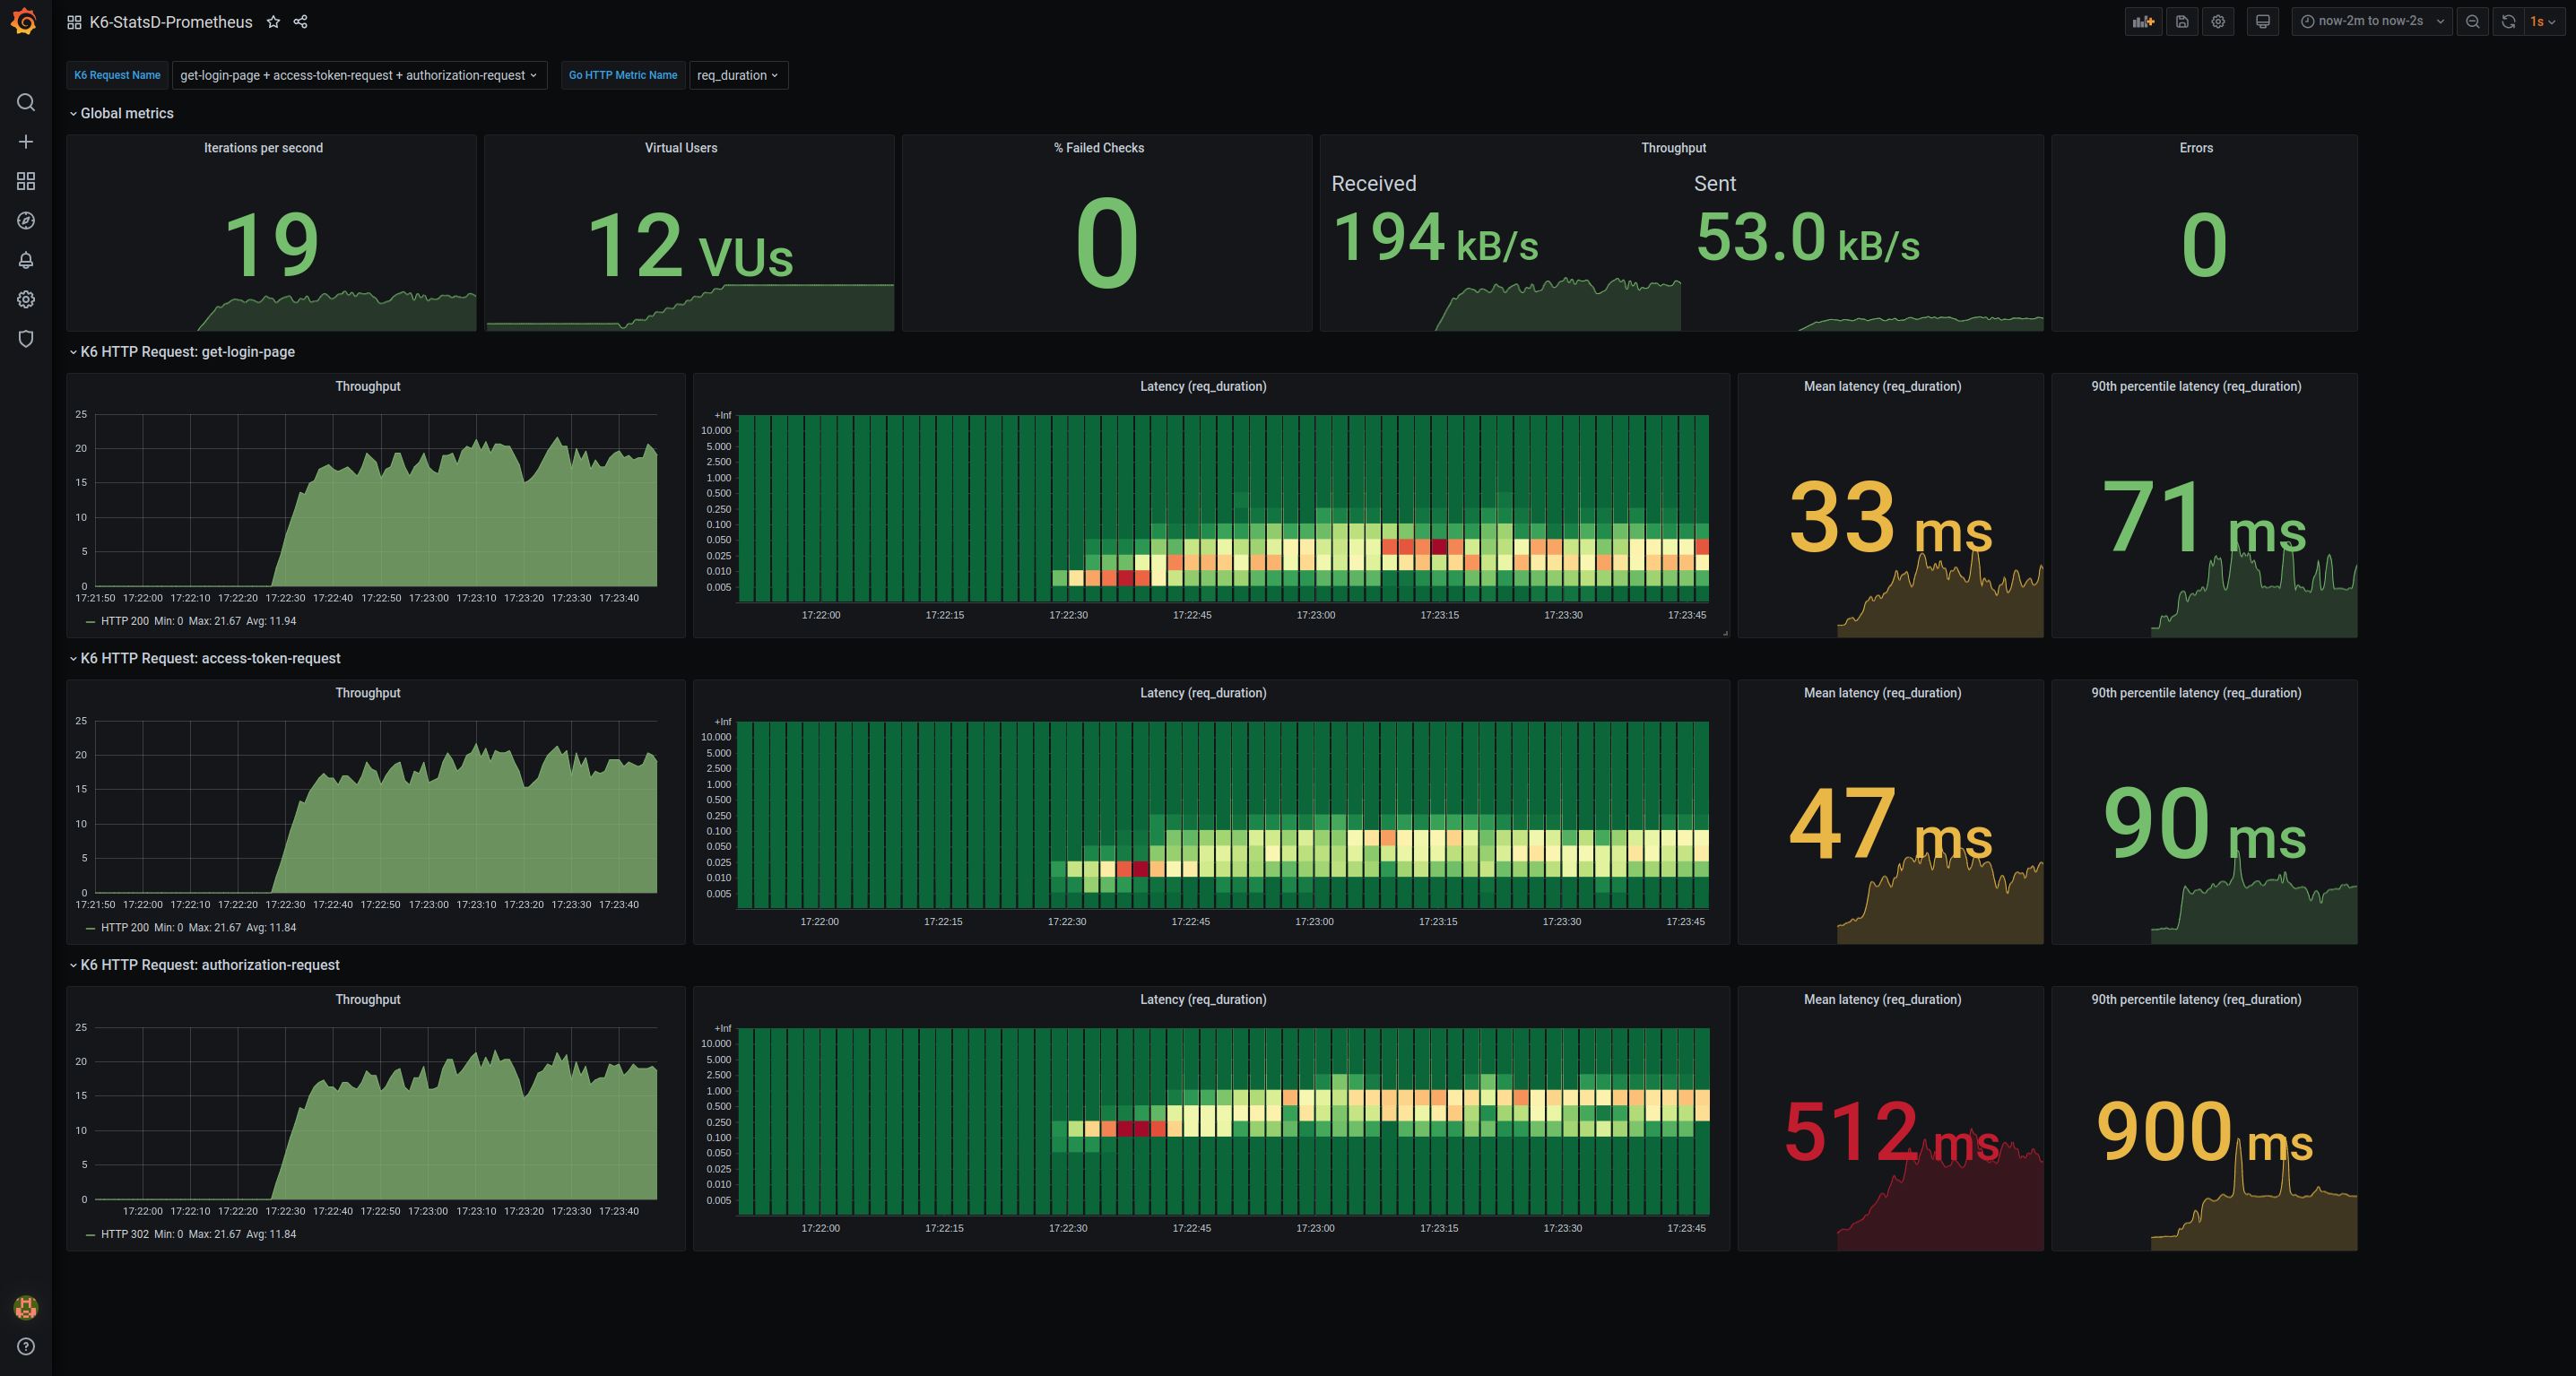
The dashboard is divided in three parts:
- the variables panel
- the global metrics panel
- a panel for each HTTP request
Through the variables panel, you can choose to observe one or multiple specific HTTP requests (tracked by their “name” tag). You can then choose which HTTP timing to observe amongst the seven standard Go HTTP timings.
The global metrics panel provides an overview of the running test:
- Number of test iterations per second
- Number of Virtual Users scheduled
- Percentage of failed checks
- Network throughput (number of bytes sent and received per second)
- Number of script errors
A panel is instantiated for each K6 request name that the user enabled in the K6 Request Name dropdown list. The request panel shows throughput and latencies for each selected request:
- Number of HTTP requests per second, grouped by HTTP status code
- Heatmap of the request latencies over time
- Mean latency with threshold at 20 ms and 200 ms
- 90th percentile latency with threshold at 100 ms and 1000 ms
Give it a try!
You can try the whole stack with this simple K6 test. It starts by defining the number of VUs over three stages: ramp-up, steady, ramp-down. It adds error counting (how many JavaScript exceptions during a test run), a very simple test function and wraps this test function with error counting.
import http from "k6/http";
import { check, sleep } from "k6";
import { Rate } from "k6/metrics";
// Scale to 2 VUs over 10s, keep those 2 VUs for 20s and scale down over 10s
export let options = {
"stages": [
{ "target": 2, "duration": "10s" }, // ramp-up
{ "target": 2, "duration": "20s" }, // steady
{ "target": 0, "duration": "10s" } // ramp-down
]
}
// K6 "Rate" metric for counting Javascript errors during a test run.
var script_errors = Rate("script_errors");
// Wraps a K6 test function with error counting.
function wrapWithErrorCounting(fn) {
return (data) => {
try {
fn(data);
script_errors.add(0);
} catch (e) {
script_errors.add(1);
throw e;
}
}
}
// A very simple test
function simpleTest() {
let response = http.get("https://test-api.k6.io", { "tags": { "name": "simple-test" } });
check(response, {
"200 OK": (r) => r.status === 200,
});
sleep(0.5);
}
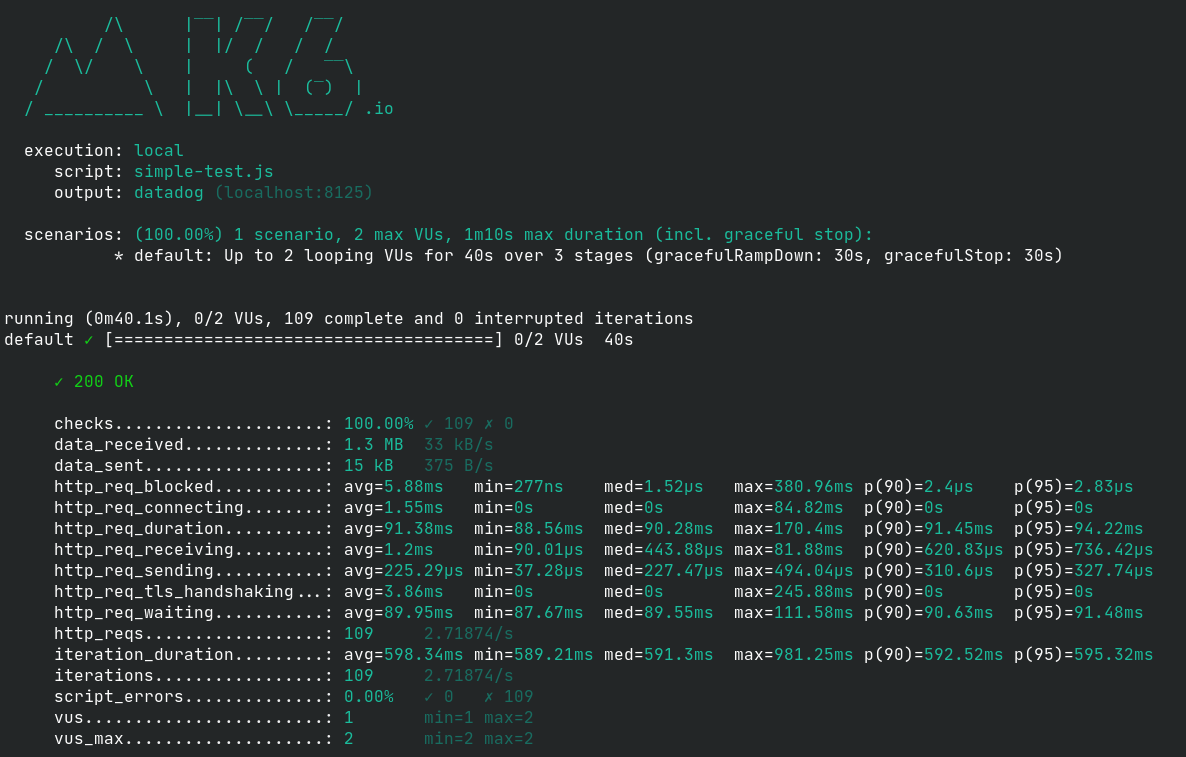
export default wrapWithErrorCounting(simpleTest);You can run the test with the k6 run command.
k6 run -o datadog simple-test.js
If everything went fine, you should see the k6 summary in the console.
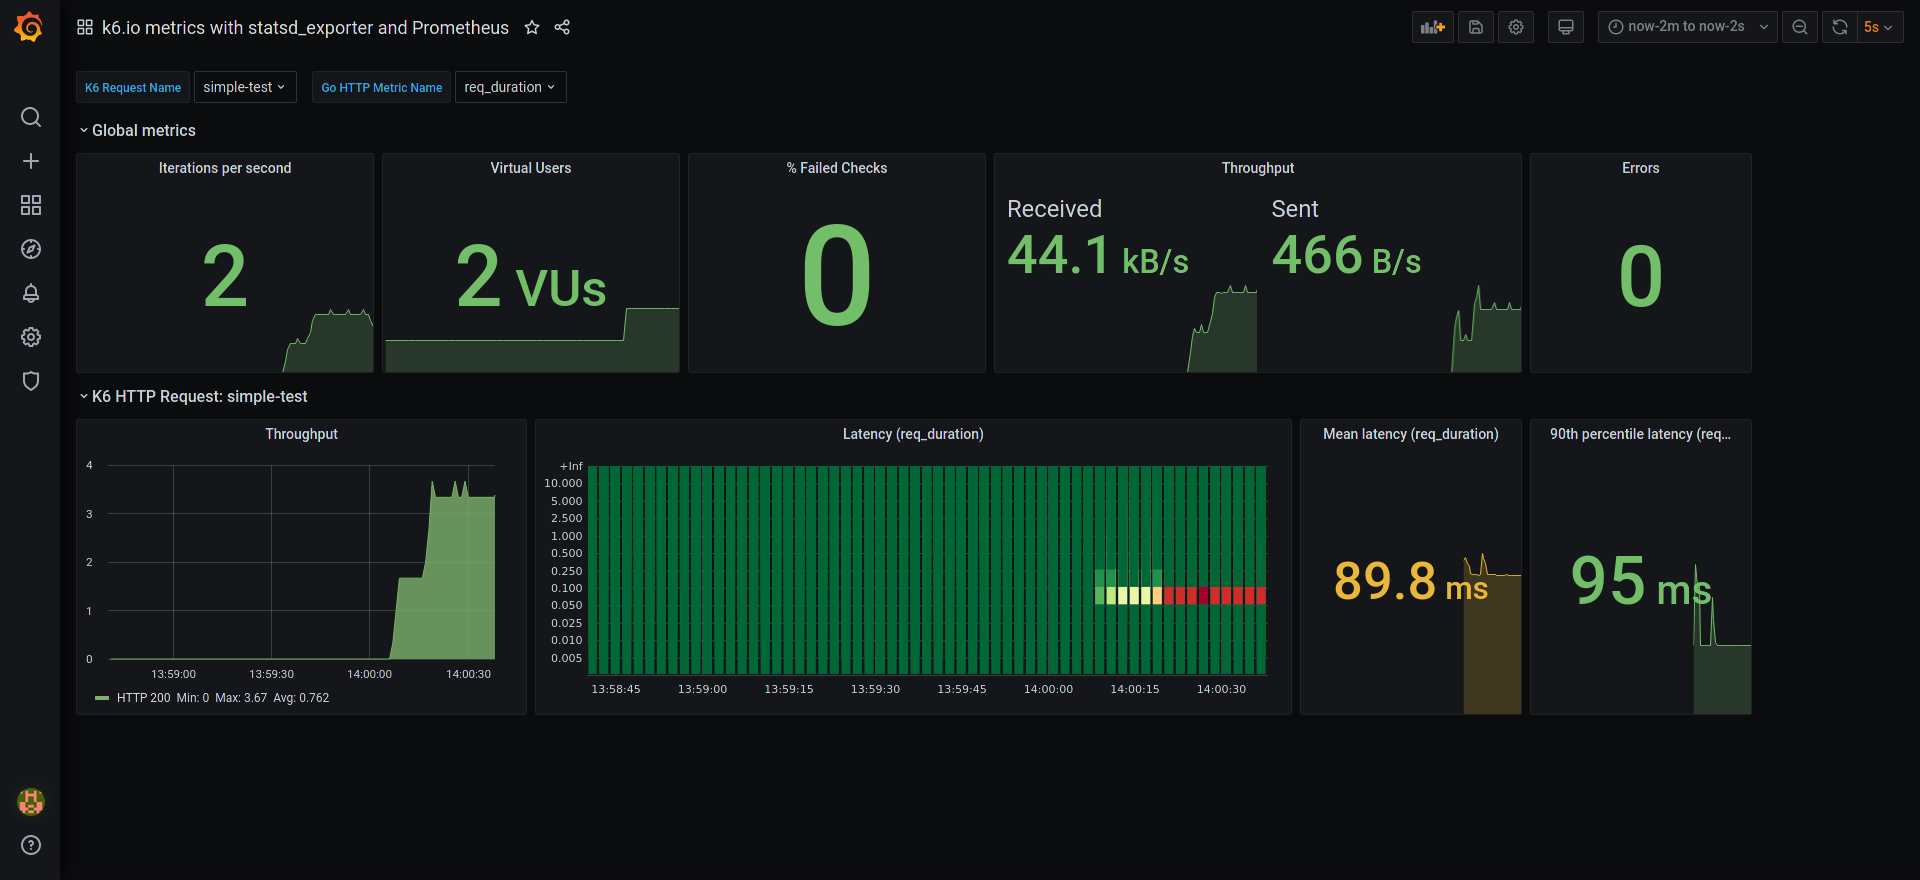
In the grafana dashboard, select simple-test in the K6 request name dropdown list and req_duration in the Go HTTP Metric Name dropdown list. Note: you might have to hit CTRL-R to reload the page if the dropdown list is empty. Then, the grafana dashboard should look like this.
Conclusion
This article reviewed the use of K6 along with Prometheus and Grafana, showed a ready-to-use Grafana dashboard and explained how to use the whole stack.